Norms and Standardized Scores
Norm and Criterion Referencing
- Norm referencing
- How well one has done relative to the norm group
- E.g., Weschler tests, GRE
- Criterion referencing
- How well one has done in a more absolute sense
- E.g., qualifying examinations for doctors, airline pilots, etc
Norms
Norm group: a reference group providing a context for interpreting scores
Norms: scores from the norm group
Standard 5.8 (p. 104)
Norms, if used, should refer to clearly described populations. These populations should include individuals or groups with whom test users will ordinarily wish to compare their own examinees.
Standard 5.9 (p. 104)
Reports of norming studies should include precise specification of the population that was sampled, sampling procedures and participation rates, any weighting of the sample, the dates of testing, and descriptive statistics. Technical documentation should indicate the precision of the norms themselves.
The “Three R’s”
- Recency
- Representativeness
- Relevance
Norm-Referenced Scores
Percentile Ranks
Standardized scores
- \(z\)-scores
- \(T\)-scores
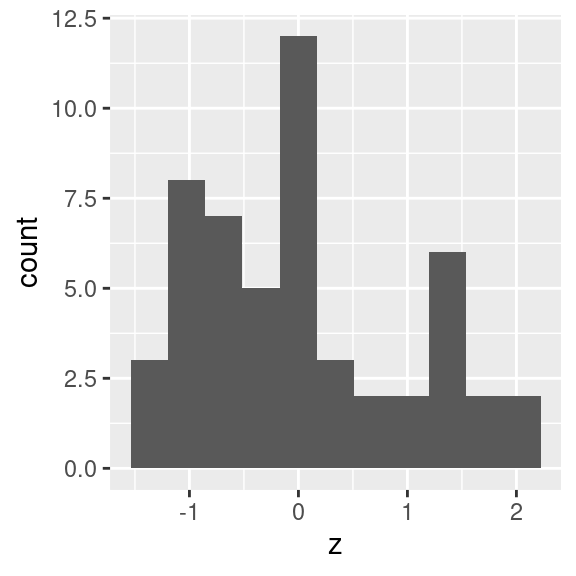
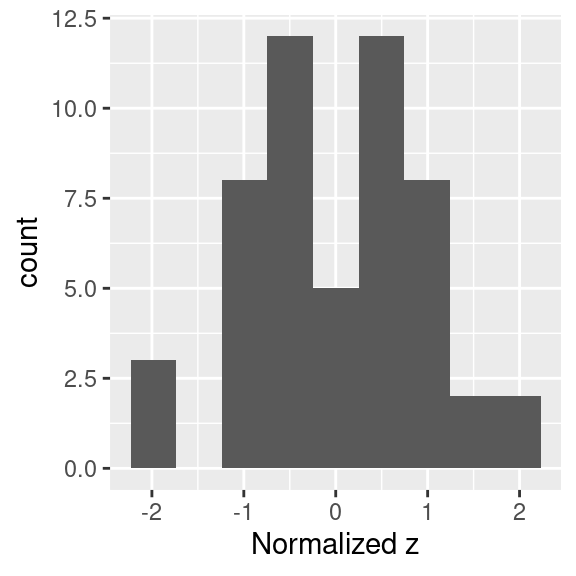
Normalized scores
- Normalized \(z\)-scores
- Stanines
- Normal curve equivalents
Percentile Ranks
| f | cf | % | c% | PR | |
|---|---|---|---|---|---|
| 25 | 3 | 3 | 5.769231 | 5.769231 | 2.884615 |
| 26 | 8 | 11 | 15.384615 | 21.153846 | 13.461538 |
| 27 | 7 | 18 | 13.461538 | 34.615385 | 27.884615 |
| 28 | 5 | 23 | 9.615385 | 44.230769 | 39.423077 |
| 29 | 5 | 28 | 9.615385 | 53.846154 | 49.038461 |
| 30 | 7 | 35 | 13.461538 | 67.307692 | 60.576923 |
| 31 | 3 | 38 | 5.769231 | 73.076923 | 70.192308 |
| 32 | 2 | 40 | 3.846154 | 76.923077 | 75.000000 |
| 33 | 2 | 42 | 3.846154 | 80.769231 | 78.846154 |
| 34 | 6 | 48 | 11.538462 | 92.307692 | 86.538461 |
| 35 | 2 | 50 | 3.846154 | 96.153846 | 94.230769 |
| 36 | 2 | 52 | 3.846154 | 100.000000 | 98.076923 |
Notes on Percentile Ranks (PRs)
\[ \begin{aligned} \mathit{PR} & = \frac{\mathit{cf} - 0.5f}{n} \times 100 \\ & = ((c\%) - 0.5 (\%)) \times 100 \end{aligned} \]
- Percentile rank is not intervally scaled
- Averaging is not meaningful
- Percentile ranks vs. percentile points
- E.g., PR31 = 70; P70 = 31
Standardized Scores
- \(z\) scores
- \(z = \frac{X - \bar X}{\mathit{SD}_X}\)
- Mean = 0, SD = 1
- \(T\) scores
- \(T = z \times SD_\text{new} + M_\text{new}\)
- Typically, mean = 50, SD = 10
Normalized Scores
Should be used very cautiously, as it may lead to non-meaningful results
Stanines
- Convert raw scores to nine possible values, each corresponding to a section of a normal curve
Normal curve equivalents
- Convert normalized \(z\)-scores to \(T\)-scores with mean = 50 and SD = 21.06
Developmental-Level Scores
- Grade-equivalent (GE) scores
- Age-equivalent (AE) scores
Obtained by using common/anchor items in adjacent grade/age levels
E.g., one can interpolate that a Grade 3 student has GE = 4.7.
Criterion-Referenced Testing
Standard 5.5 (p. 103)
When raw scores or scale scores are designed for criterion-referenced interpretation, including the classification of examinees into separate categories, the rationale for recommended score interpretations should be explained clearly.
- E.g., Psychopathology, skills
Standard 5.21 (p. 107)
When proposed score interpretations involve one or more cut scores, the rationale and procedures used for establishing cut scores should be documented clearly.
Standard 5.23 (p. 108)
When feasible and appropriate, cut scores defining categories with distinct substantive interpretations should be informed by sound empirical data concerning the relation of test performance to the relevant criteria.